
A Visual Way to Explore My Musical Universe
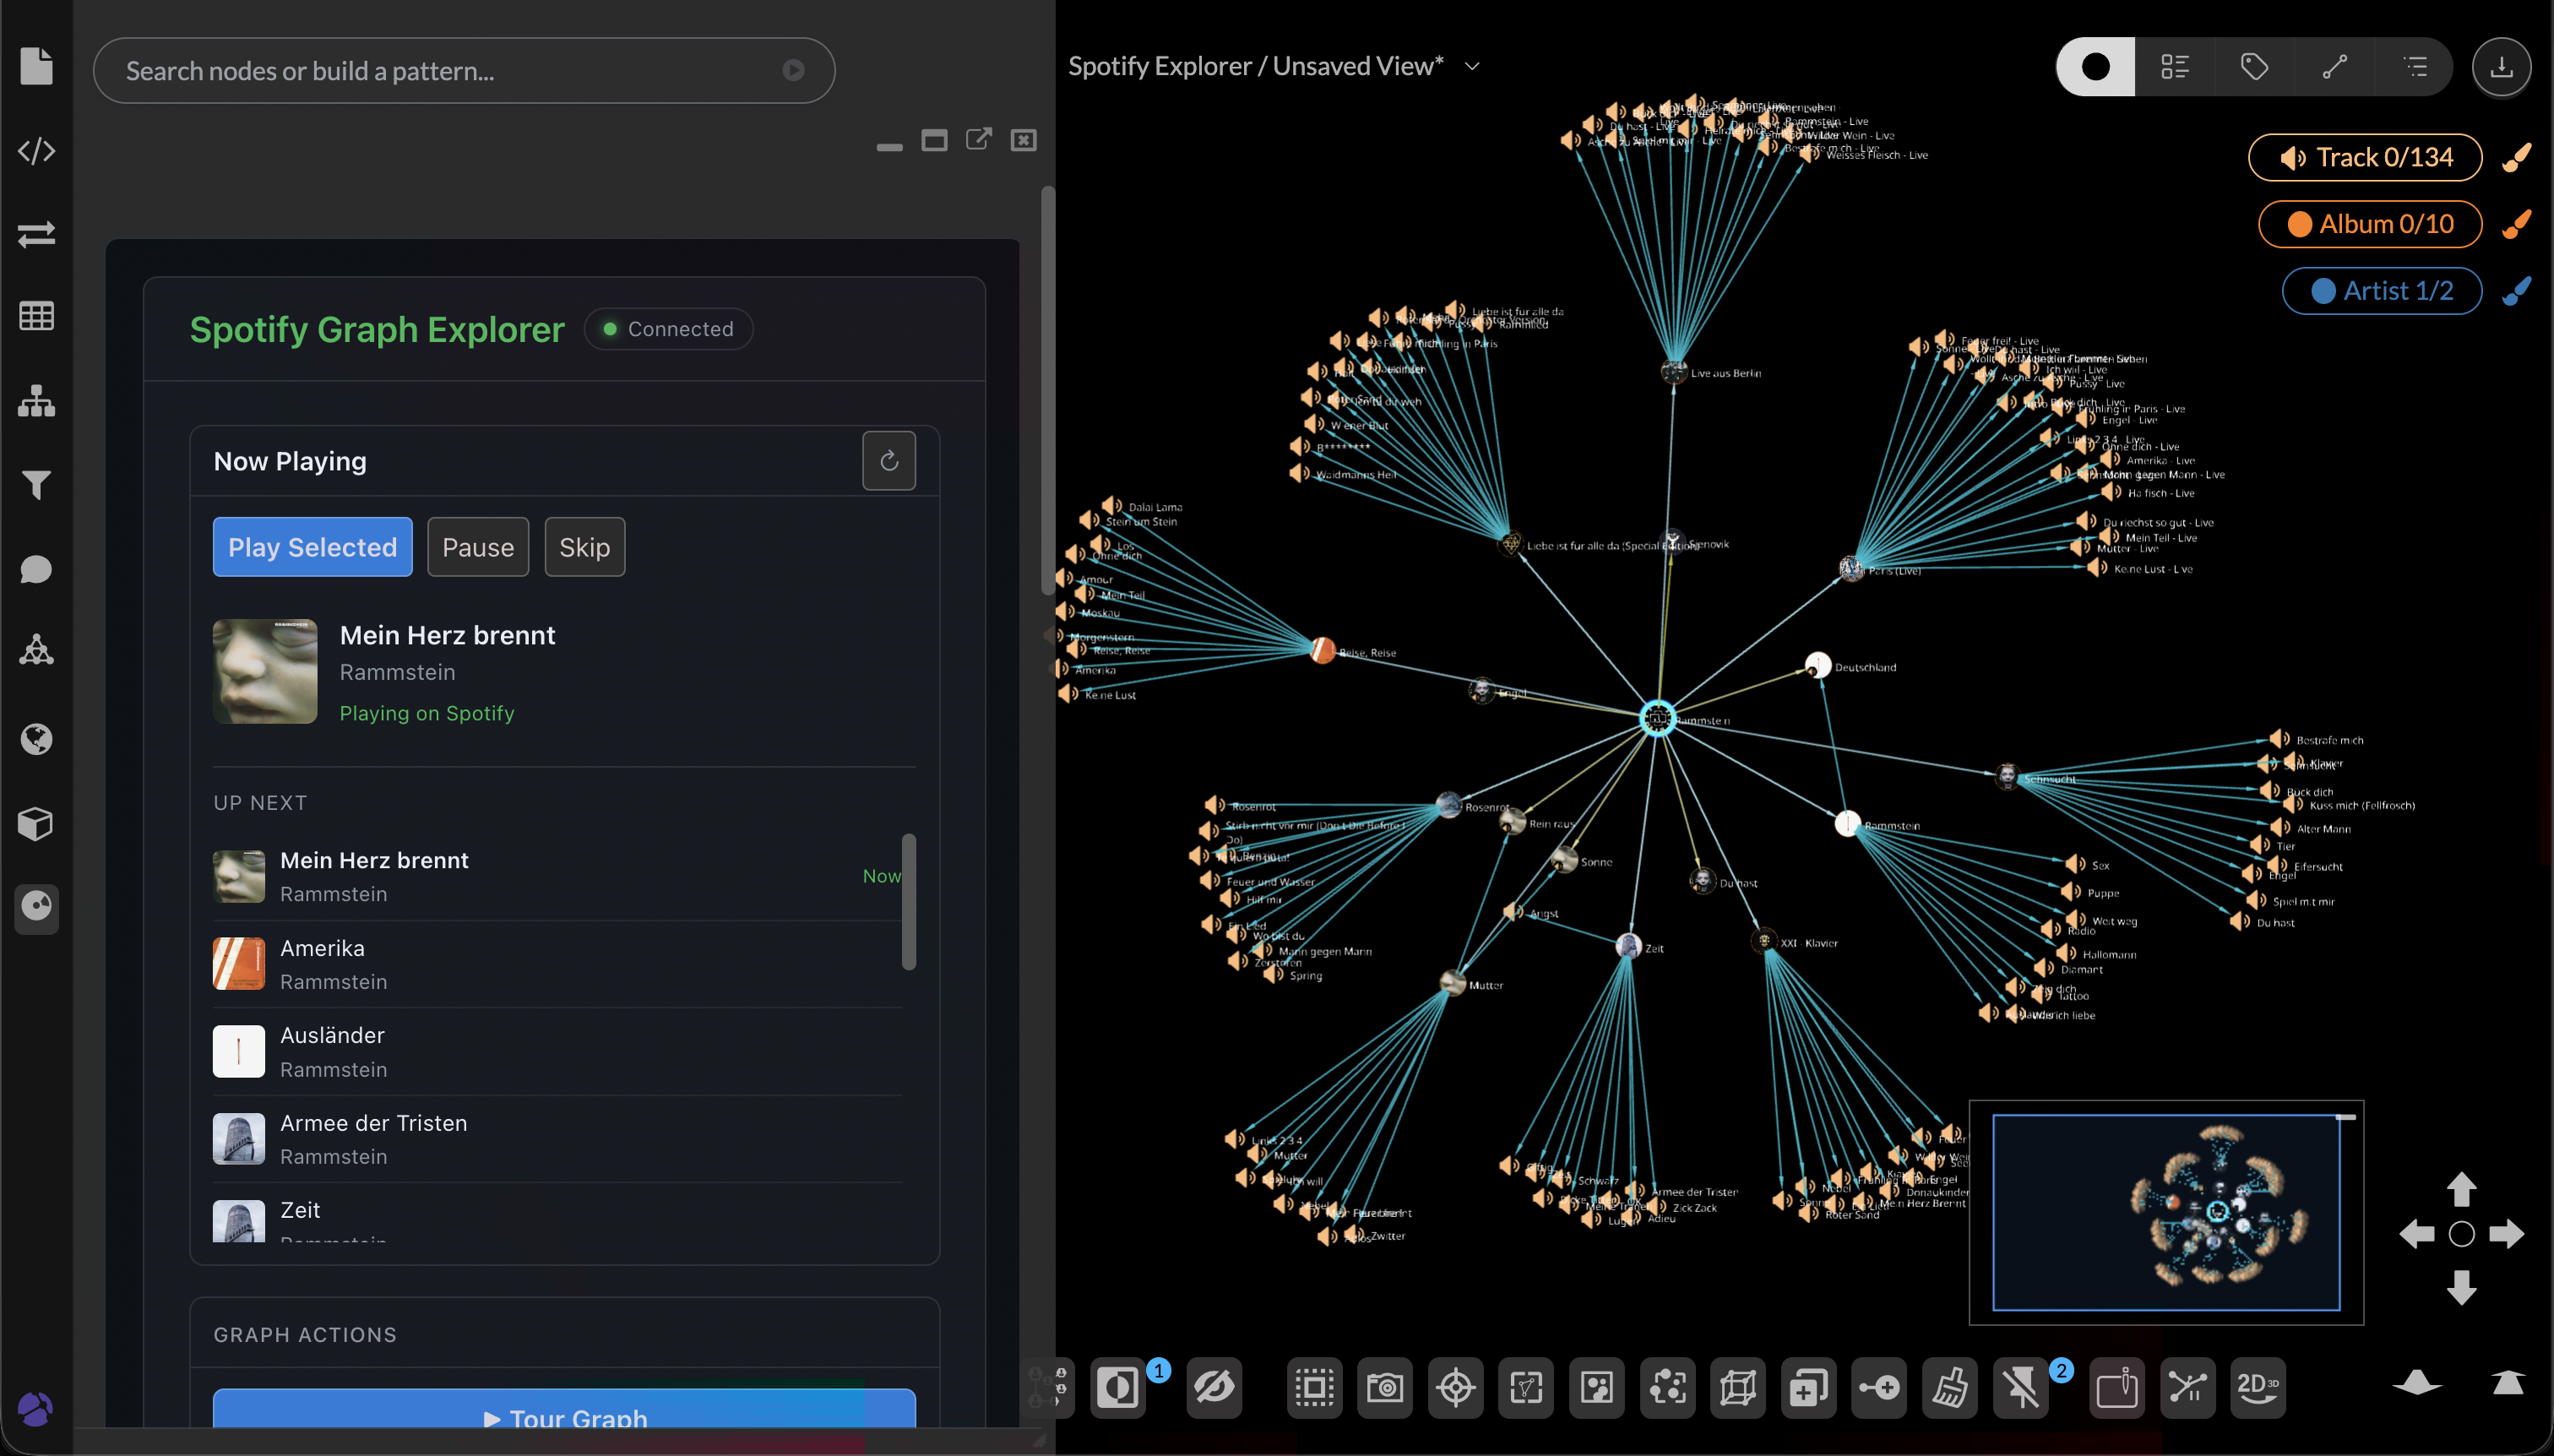
Did you ever feel like you lacked a visual way to explore your musical universe?
Sometimes I have no idea what to listen to. Like anyone, I have the tracks and artists I listen to most. But how about when I want to expand my bubble?
I have seen some graphs that show connections in D3.js, but I want to see what I could get from the GraphXR ecosystem integrated with my Music Provider, Spotify.
So I built it. I used Grovebook, a notebook environment from GraphXR, and wired it to the Spotify Web API. You log in, search for an artist, and a few seconds later, the catalog is in front of you. The artist sits at the center. The albums wrap around it — every track branches out from its album.
The Spotify Explorer is showing 134 tracks across 10 albums radiating from a single artist node, with “Mein Herz brennt” playing.
I searched Rammstein first. I like Rammstein, and I thought I knew their catalog well. The graph returned 134 tracks across 10 albums, and I realized how many of them I had never played.
I clicked on one I did not recognize. The song started, and it felt like I had known it for a long time. I cannot describe the feeling any better.
This is the thing Spotify’s recommender rarely does for me. It sends me to adjacent artists and new mixes. It rarely walks me into the corners of the bands I already love. The graph does. The graph shows the whole catalog and lets me pick.
That is what I wanted when I started this, and that is what the Explorer is: a visual way to walk your musical universe, not the algorithm’s version of it.
If you want to try it, pick one artist you think you know inside out. Open the Explorer, search for the name, and count how many tracks on your screen you have never actually played.
If you want to see what walking a catalog like this actually feels like, I recorded a short tour of the Explorer: