
Graph-Based Investigation of Fraud Rings
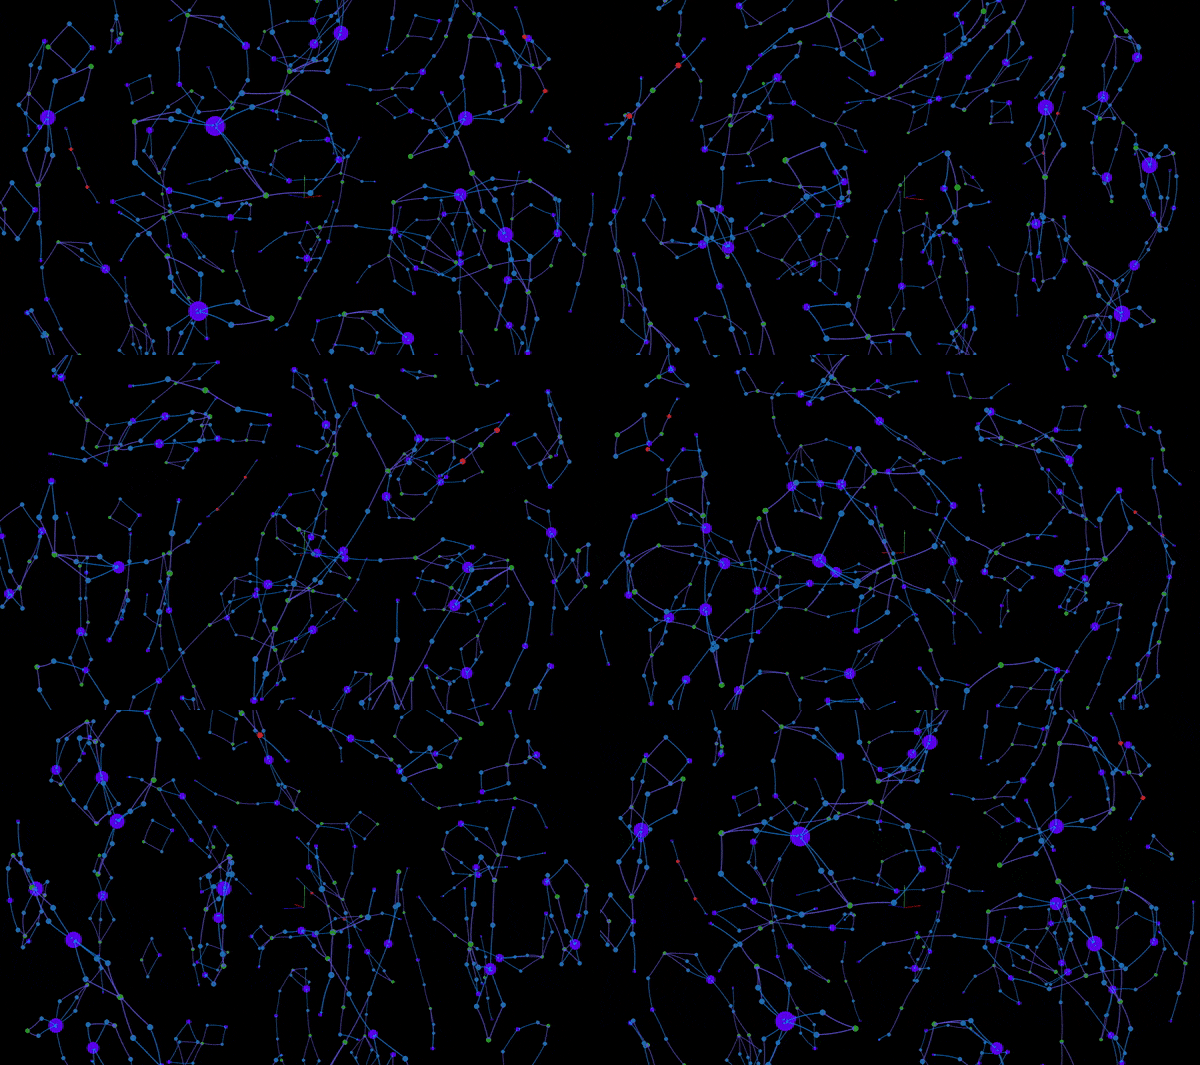
Coordinated fraud schemes are an increasing threat to individuals, businesses, and governments. According to Javelin Strategy & Research’s 2021 Identity Fraud Study, fraud losses in 2020 rose to an astounding $56 billion USD, with identity fraud accounting for $43 billion of that total. What these numbers fail to convey though, is the human impact on individuals — losing their life savings or the ability to pay for medical necessities, and on businesses — by closing or downsizing putting people out of jobs, plus the loss of trust in the public systems upon which we depend. The need to detect and prevent fraud cannot be overstated, and it’s a burden that most organizations shoulder internally or require a significant financial investment in dedicated services to target such abuses.
Fraud is rarely evident from individual data points i.e., a single transaction. Rather, it is apparent in the patterns shown using multiple data points, such as a single credit card number used in transactions across multiple locations. In particular, fraud rings — defined as organizations that perform activities with the intention to defraud or take advantage of other people — tend to employ coordinated tactics that form distinctive patterns.
Unfortunately, the specific tactics vary across fraud targets, the perpetrators committing fraud, and evolve over time. This was especially evident during the pandemic and shutdowns, as buying practices changed dramatically, and in the trends to online banking and borrowing. This makes ongoing exploratory analysis an important component of an anti-fraud strategy. Graph visualization is a powerful tool for spotting suspicious connections between data like email addresses, phone numbers, and other personal identifiable information (PII).
Running exploratory data analysis
To showcase GraphXR’s powerful ability to uncover fraud, we decided to utilize Neo4j’s fraud sandbox as a test case. Neo4j’s fraud sandbox, based on synthetic datasets generated by the PaySim mobile money simulator, provides an excellent demonstration of how to model and analyze transaction data as a graph. When put into GraphXR, it can be visualized at scale and can enable an intuitive investigative workflow for fraud detection.
Neo4j offers many Sandbox datasets, providing a quick and easy way to get up and running with a graph database. In just a few steps, you can launch Neo4j’s Fraud Detection sandbox and connect it to GraphXR for interactive visualization.
Once setup is complete, navigate to the GraphXR Project panel=>Category tab. Here, one can pull in Client data as nodes and expand upon their relationship, [SHARED_IDENTIFIERS]. Shared identifiers in this dataset can be anything from shared email addresses to shared social security numbers (SSN). Since more than one person having the same SSN is an immediate red flag, we can extract the SSN in the data and see how many clients are connected to the same SSN. In the view below, we see the node size and caption weighed by the node’s degree of connection. Larger SSN nodes have a higher degree of clients associated with the same SSN. This is highly problematic and a strong indicator of identity theft.
This example is just scratching the surface of what’s possible when you bring the power of graph to fraud investigation. Fraudsters rely on their ability to remain hidden behind synthetic identities, beneath misinformation, and between transactions. Graph visualization shines a light on their activities. With this crucial first step of detection accomplished, actions can be taken to prevent and remediate fraud.
Thank you to Neo4j for providing the Fraud Detection sandbox to demonstrate how you can address this growing problem. Follow us on LinkedIn or Twitter for more GraphXR tutorials or contact us for a demonstration. Happy graphing!