
How to Pinpoint NYC’s Most Dangerous Driving Hours Using Data
New York City runs on a 24-hour clock, but not all hours are created equal — especially when you’re traveling on the road.
To understand where crashes happen, the best tool is a map. At the same time, the best tool to understand when crashes happen is a chart. However, when they work together — that’s when magic happens.
 New York City’s Motor Vehicle Collisions Crashes from July 2025
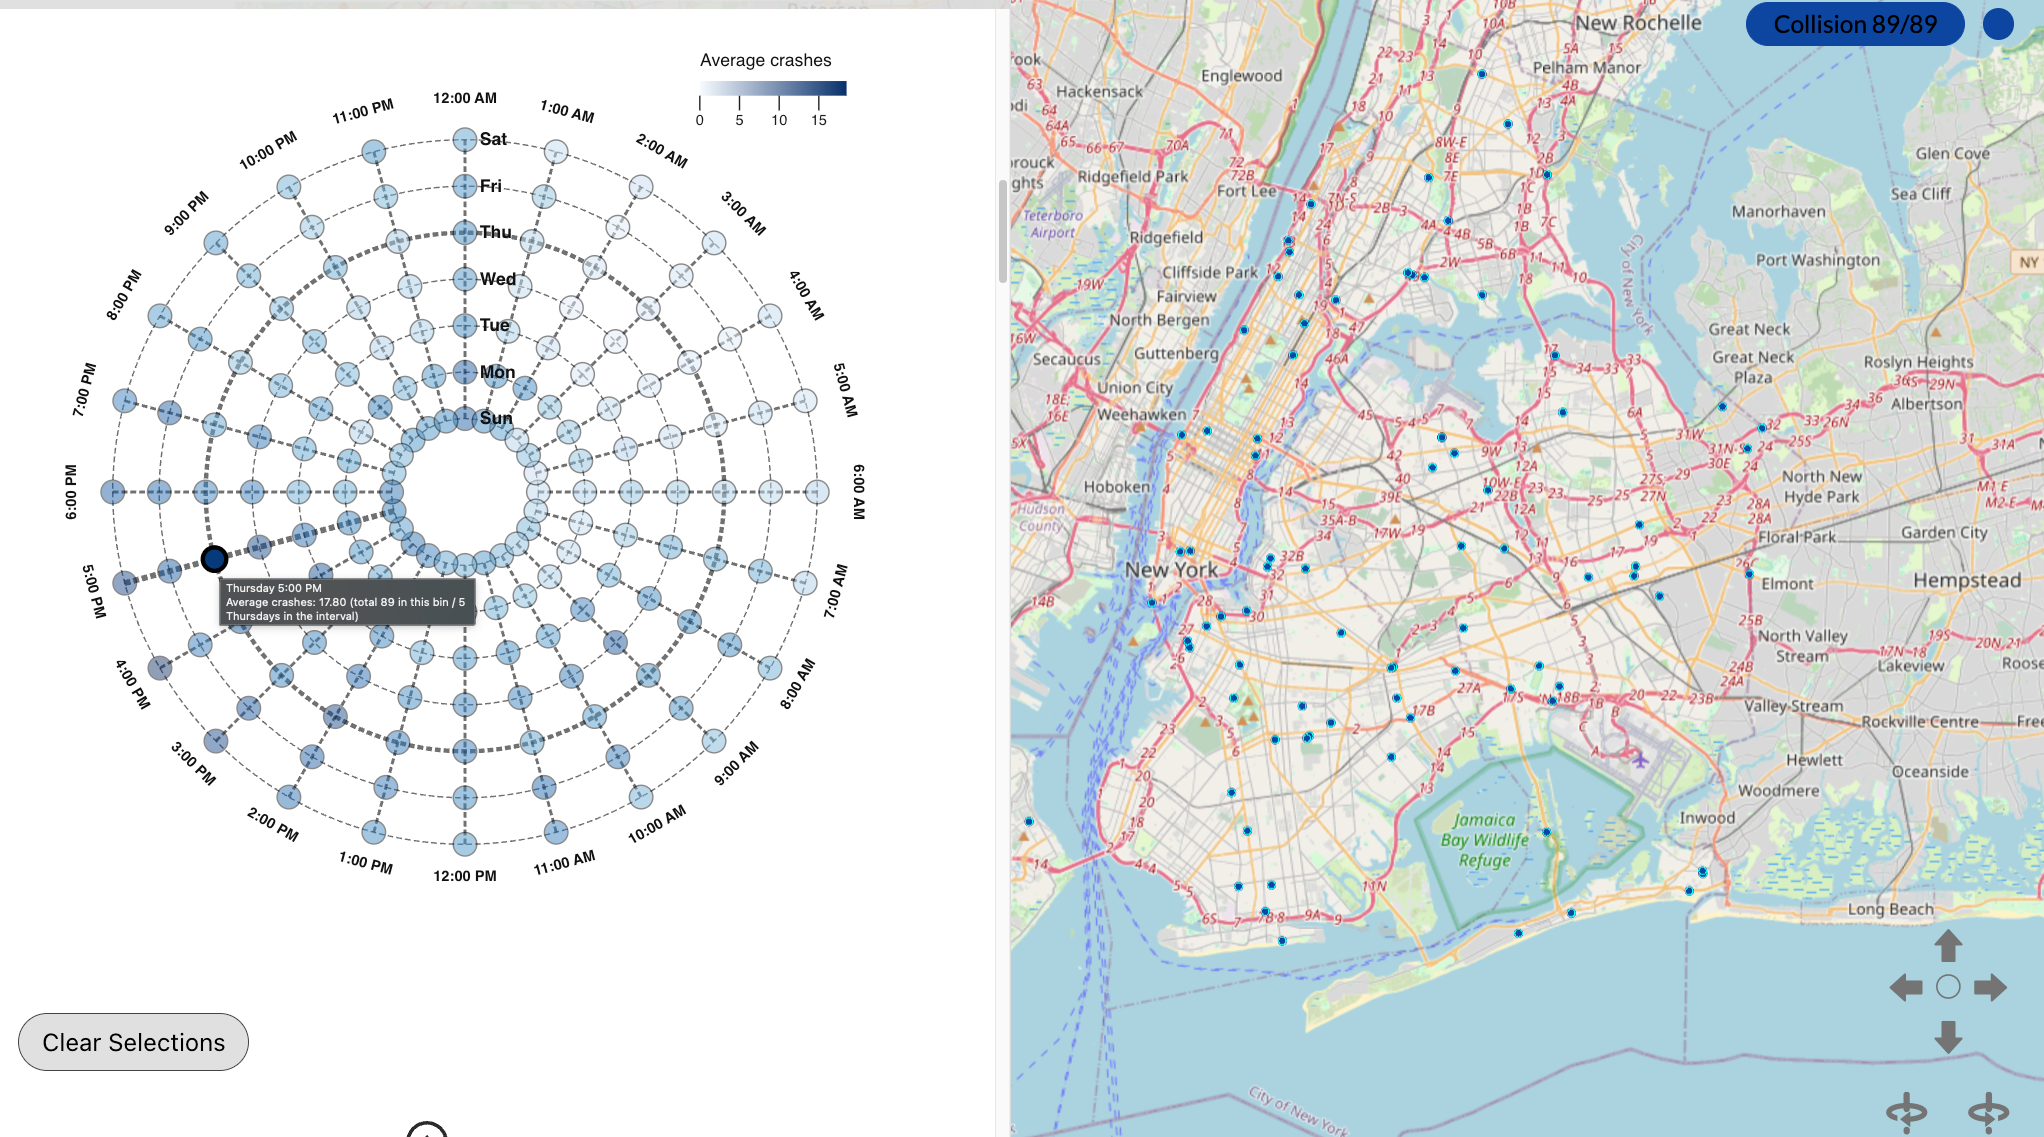
We pulled a sample of NYC’s motor vehicle collision data for July 2025 into GraphXR and used Grove to combine a radial chart of weekly crash times with a dynamic map. Using this, viewers can instantly see how the city’s daily rhythms dictate its traffic patterns, pinpointing the most dangerous — and safest — times to be on the move.
The City’s Rhythm: Reading the WeekDial Chart
The visualization at the heart of our analysis is the WeekDial. Before we dive into what it’s telling us, here’s a quick guide to understanding how it works:
- The Clock: The chart is a 24-hour clock, with midnight at the top.
- The Days: Each dashed ring is a day of the week, from Sunday on the inside to Saturday on the outside.
- The Data: Each circle’s color shows the average of crashes for that specific hour and day. The darker the blue, the more crashes occurred.
 New York City’s Average crashes for July 2025
Key Insights from the Data
This single chart tells a powerful story about how New York’s daily schedule collectively impacts traffic safety.
1. The Daily Grind: Commute Hours Dominate
The most obvious pattern is the dark blue bands on weekdays (Monday-Friday), which perfectly align with rush hour.
- Morning Rush (7 AM — 9 AM): A clear spike in crashes appears as the city commutes to work and school. For example, an average of 15.8 crashes on Wednesday by 9 AM, which means a total of 79 crashes / 5 Wednesdays in that month.
- Evening Rush (3 PM — 7 PM): The afternoon shows an even darker, more dangerous period. This evening surge is likely amplified by commuter fatigue, post-work errands, and fading daylight, making it the riskiest time on weekdays.
2. The Weekend’s Different Pulse
Saturdays and Sundays break from the work week’s rigid schedule, showing a more relaxed, leisure-driven pattern.
- No Morning Rush: The 9 AM spike vanishes.
- Afternoon & Evening Peaks: Crashes build slowly from noon, peaking in the late afternoon and evening as social activities ramp up.
- Saturday Night Risk: Saturday shows a notable number of crashes late at night (10 PM — 1 AM), a clear sign of the city’s nightlife.
3. The Single Most Dangerous Time Slot
If you could avoid driving at one specific time, when would it be? The data points to a clear answer: Thursdays by 5:00 PM with an average of 17.8 crashes (a total of 89 crashes/ 5 Thursdays).
How did we do this?
The idea was to allow the user to explore in one step. Instead of using separate and static charts, we linked the map and the WeekDial together, turning it into a powerful analytical tool.
Here’s how:
- Connect everything: Lassoing a hotspot on the map instantly filters the WeekDial. Clicking a time slot on the WeekDial updates the map immediately.
- Intuitive Controls: Employ sliders and toggles to allow users to filter by date range or focus on specific data points without needing a complex query.
- From “When” to “Where” in a Click: Two-way filtering enables users to test hypotheses instantly. For example, is the 5 PM spike a citywide problem, or is it concentrated on specific highways? Are cyclist-involved collisions peaking at different hours? This tool helps you find out.
Such interactivity transforms a simple dataset into a dynamic story, revealing patterns that would otherwise remain hidden in spreadsheets.

The Pulse of the City
This WeekDial visualizes the pulse of New York City. 🗽 By linking temporal data with a geographic map, we can move beyond just seeing hotspots to understanding the rhythms that create them. It’s easy to see that traffic safety isn’t just about place — it’s deeply intertwined with time. Unsurprisingly, we learned that people crash on their way to work and even more on the commute home. The weekend contains its own unique risks, too.
The WeekDial can be used to explore any temporal data that has geolocation data attached to it. We chose to explore collisions in New York City, but what else can you imagine exploring?
Conclusion: The Safest Time to Drive
Finally, when is the safest time to drive in New York City, after all?
According to the data for July 2025, the roads are calmest in the early morning. The hours between 1:00 AM and 6:00 AM are consistently the safest across the entire week, with few reported incidents. If you’re on the road in the city? That’s a great time to be out and about. Maybe pick up a cup of coffee before you go.