
Leveraging GraphXR to Study Ransomware Threat Actors
by Nedelcho Mihaylov, CyberPeace Institute with Weidong Yang, Kineviz, Inc.
CyberPeace Institute x Kineviz
Over the past several months, the CyberPeace Institute has developed Ransomware: Follow the Threat Actor, a new project that leveraged Kineviz’s GraphXR to visualize and expose connections between ransomware threat actors. The Institute explored links between a sample of ransomware threat actors, the online infrastructure they used, the countries they appeared to be connected to, and incident trends. GraphXR enabled us to accelerate interactive visual analysis, make complex country-actor and infrastructure sharing patterns visible, and surface two main findings:
- Shared hosting providers: We immediately found threat actors who relied on the same service providers for hosting or related services
- Proximity and reuse of IP addresses: Correlating the IPs reported showed us where the same address was used by more than one threat actor within a short period, and where multiple actors operated within a small set of IPs on the same network.
Note: This blog post summarizes analysis steps and high-level results. For more details, see the full report.
Who we are
The CyberPeace Institute is an NGO that supports other NGOs, non-profits, and members of vulnerable communities by strengthening their cybersecurity. Our initiatives include:
- Exposing the harm caused by cyberattacks, information operations, and the proliferation of harmful content: We transform complex information into actionable insights by collecting, processing, and analysing both structured and unstructured data using a combination of AI tools, manual processes, and expert knowledge. These insights help underserved organizations, storytellers, and policymakers better understand and respond to the human impact of cyber incidents.
- Capacity Building: Through our CyberPeace Builders program, we connect nonprofit organizations with volunteers from security vendors who provide hands-on cyber expertise and guidance.
- Threat Investigation: We conduct in-depth research into cyber threats and threat actors impacting vulnerable communities to better understand the evolving threat landscape. Our Cyber Incident Tracer platforms Health, Ukraine, and the recently launched CyberPeace Tracer exemplify these efforts.
- Advocacy: We champion responsible behaviour in cyberspace, emphasizing the protection of fundamental rights and freedoms for all people.
About the Ransomware Project
Our Ransomware: Follow the Threat Actor project, and report, aims to strengthen state-level responses to ransomware by demonstrating links between geographic location and ransomware actors.
The core dataset links ransomware threat actors to countries through court rulings, law-enforcement operations, and technical/political attributions.
In addition to that country-actor dataset, the Institute analyzed:
- A global sample of ransomware incidents (2020–2025),
- An infrastructure dataset for a concrete sample of threat actors, 24 actors, 2,644 infra entries (IPs, ASN org names, etc.) which we used to detect reuse and sharing of online infrastructure.
Analyzing Ransomware Threat Actors with GraphXR
GraphXR is an interactive graph analytics and visualization platform designed for large heterogeneous datasets. It supports fast, GPU-accelerated rendering, dynamic filtering and queries, temporal exploration, and graph algorithms such as centrality, community detection, and path finding. Its features make it well suited for exploratory research into the relationships between actors, countries, and infrastructure.
Our investigation focused on three main areas:
- Visualizing the connections between threat actors and countries.
- Exposing patterns of global ransomware incidents.
- Exploring the infrastructure used by threat actors.
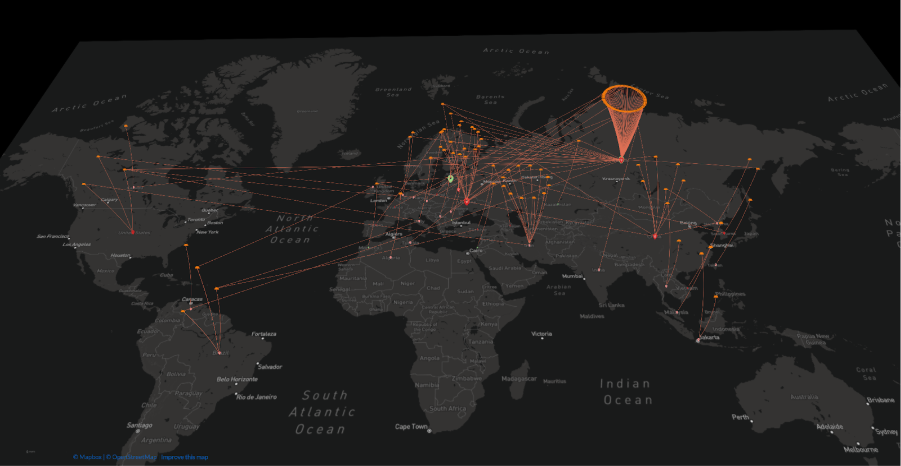
Threat actor country connections: Visualization for Analysis & Presentation
Purpose: To visualize the connections between threat actors and countries. To achieve this, we:
- imported the country-actor relationship dataset (nodes: threat actors, connection countries),
- used attribute-driven layouts to separate countries and actors,
- used connection function to combine information on threat actors with more than one connection country.
- exported high-resolution visuals and interactive views for embedding in reports and briefings.
For example, displaying connected information on a world map let us export clear visual information, while allowing further exploration of the live data.
Press enter or click to view image in full size
Exposing Global Ransomware Incidents
Purpose: We needed fast, interactive discovery of trends to guide deeper network queries and to select representative cases for deeper analytical follow-up. To achieve this, we:
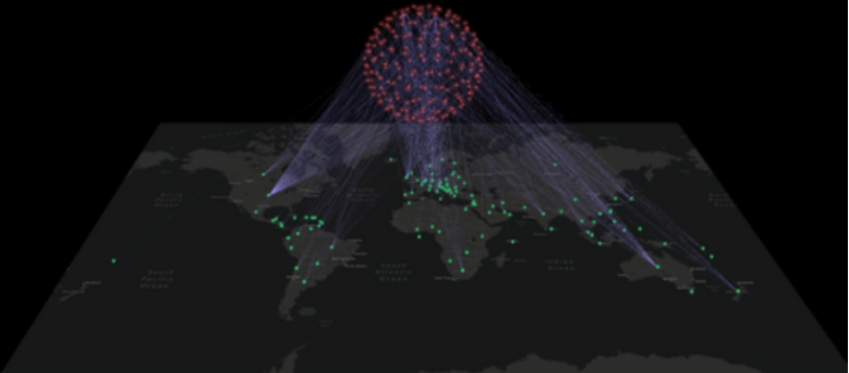
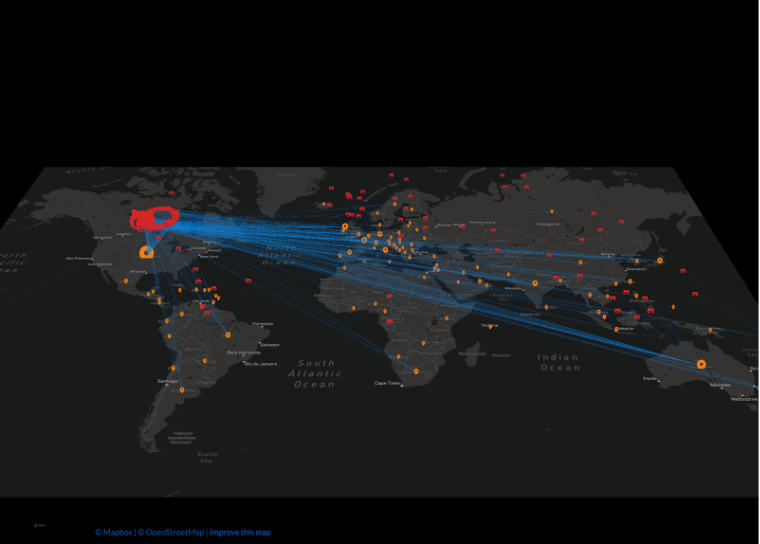
- loaded the incidents table (n = 2,753) into GraphXR’s tabular view and linked it to event nodes in the graph model,
- used aggregated node metrics and attribute filters to rapidly surface top trends: the most active actors in the period, most targeted sectors, and most targeted countries.
Press enter or click to view image in full size
Exploring Threat Actor Infrastructure
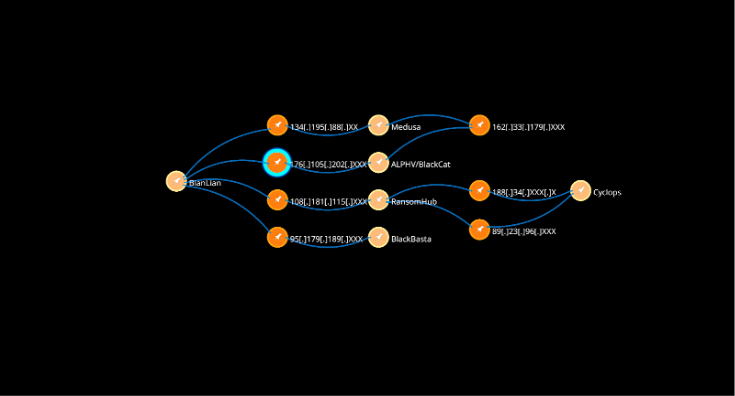
Purpose: To detect reused or shared infrastructure or overlapping operational infrastructure. We computed unique counts: from 2,644 infra entries → 1,157 unique IP addresses associated with the 24 sampled threat actors,
- constructed a bipartite graph linking threat actor nodes to IP address nodes (and ASN org name nodes as attributes),
- cleaned the graph by removing floating nodes and isolates (noise reduction).
As a result, we observed six threat actors using the same seven unique IP addresses. We then flagged those shared IPs for further technical and investigative triage.
Press enter or click to view image in full size
Key Findings
- The country-actor dataset revealed multiple linkages between threat actors and specific countries, corroborated by judicial and law-enforcement sources. GraphXR visualization provided highly effective images for communication with policy audiences.
- From the global incidents sample (2020–2025), GraphXR enabled rapid identification of top actors, sectors, and country targets. We used this information extensively to create trend tables and charts in our report.
- In the infrastructure analysis, six actors shared seven unique IP addresses — a strong signal of shared infrastructure worth operational follow-up.
Press enter or click to view image in full size
Key Advantages of using GraphXR
- Speed & interactivity: GPU-accelerated rendering and instant filtering allowed analysts to iterate on hypotheses (e.g., “Which actors share infrastructure X?”) without costly preprocessing.
- Integrated tabular + graph view: Analysts could switch fluidly between row-level data and node/edge visual context to validate anomalies.
- Temporal exploration: Timeline controls made it easy to test whether infrastructure reuse coincided with incident bursts or law-enforcement actions.
- Clean exports for stakeholders: The platform produced both static visuals for reports and interactive exports for briefings with technical partners.