
SightXR & Kùzu for building rapid, transparent knowledge graphs
A common hurdle in adopting graph databases is the complexity of setting up and managing traditional server-based infrastructures. To address this, we’ve partnered with Kùzu, an open-source, embedded graph database that seamlessly integrates into larger applications. With its embedded storage and user-friendly interoperability, Kùzu keeps data ingestion simple and scalable — while SightXR provides transparent, real-time visual analytics. Together, we ensure even the most complex data sets remain accessible and insightful.
Why Kùzu?
- Optimized for fast graph traversals with novel join algorithms
- Disk-based storage (in addition to in-memory solutions)
- Lightweight deployment that doesn’t require a full server stack
By combining Kùzu’s agility with SightXR’s visualization capabilities, we can scale effortlessly from quick prototypes to large datasets — an essential advantage when working with graph analytics and growing data volumes.
From Black Box to Transparent Workflows
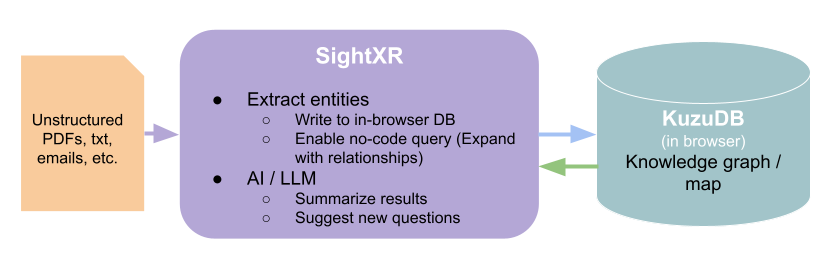
When transforming unstructured data such as PDFs, emails, and other documents into rich knowledge graphs, we’ve taken an approach that integrates GenAI, graph technology, and visual analytics (what we call Graph Business Intelligence or GraphBI) to boost transparency. While Retrieval-Augmented Generation (RAG) and GraphRAG are excellent for summarization and Q&A, they often function as black boxes, obscuring how results are generated. In contrast, GraphBI places visual analytics at the center of the workflow, offering a more traceable experience. This step-by-step, auditable process fosters trust and clarity, allowing analysts and decision-makers to see exactly how insights are formed.
From PDF to Knowledge Map
To demonstrate this workflow, we analyzed the Bipartisan House Task Force Report on AI, paying particular attention to Congress’s perspective on AI’s impact in the health sector. We use GenAI to automatically extract and link entities — such as people, organizations, locations, and events — creating a knowledge map in Kùzu in the process. SightXR then brings this graph-based data to life visually, enabling analysts to explore relationships, discover hidden connections, and refine their models in just a few clicks.
Defining Your Schema in SightXR
Within SightXR, you can tailor how unstructured data is transformed into a knowledge graph by adjusting your data model (schema) and selecting the Large Language Model of your choice. We start with a default configuration — POLE (People, Organizations, Locations, Events) — alongside GPT 4o, to rapidly spin up an exploratory environment. As new patterns emerge, you can refine these models iteratively, ensuring your workflow adapts to the data, rather than forcing the data into a rigid structure from the outset.
Quick Drag-and-Drop Data Ingestion
When we drop the PDF report into SightXR, named entity extraction runs automatically and “observation” nodes are created to describe how mentioned entities in the report connect. Each observation is explainable as it references the original chunk of text it was derived from, letting us validate insights at any point.
A pull of all the entities and observation across the report
An observation node has an explanation and sources where in the doc it was found
What does this report tell us about Congressional regulations on AI and how they may impact the health sector?
To focus our analysis, we perform a keyword search for “health” across the knowledge graph, revealing 46 entities and 89 observations. From there, we can pivot from a keyword search to a hierarchical graph view — expanding health-related entities to uncover second- and third-degree connections.
Keyword search for “health” across entities and observations
As we expand the graph, SightXR quickly highlights clusters centered on key concepts like “AI” and “Congress.” While those are expected, we also find a cluster around the NIH (National Institutes of Health). Curious about this, we switch to a hierarchical tree view to examine the NIH’s connections, see which other entities link to it, and discover the topics it influences.
Force layout to show central entities in the knowledge graph
NIH and it’s connected entities and observations organized in a hierarchical tree layout
Iterative Investigation
From these observations, we can pivot into chat-based inquiries — starting with “Why is this important?” and then diving further into specific questions. Throughout the process, we keep a birds-eye view of the document’s broader context. And because SightXR lets us save and share these “views,” it’s easy to collaborate across our team and preserve the investigative trail for everyone involved.
Q&A in SightXR
SightXR suggests further questions to expand your investigation
Saved views in SightXR
Kùzu’s Cypher Support
We can expand and refine our analysis by running Cypher queries directly on Kùzu. After pointing Kùzu to the file we want to explore, we can execute anything from simple matches to advanced pattern searches, gaining a level of granularity beyond what standard visualizations alone can provide. This illustrates how easily we can extend our analysis with a more powerful query language, while Kùzu-Wasm (the version of Kùzu that runs in browser) ensures seamless scalability as data volumes grow.
Conclusion
Speed, Flexibility, and Transparency form the foundation of our partnership with Kùzu. By uniting SightXR’s visual, iterative exploration with Kùzu-Wasm’s fast graph traversals in the browser, we make it simpler than ever to transform unstructured documents into actionable knowledge graphs. Analysts can skip over complex database deployments, focusing instead on extracting insights and refining data models in real time.
Whether analyzing legislative reports or corporate documents, harnessing GenAI-assisted knowledge graphs, intuitive visualization, and embedded database performance unlocks the often-neglected 80% of enterprise data. With Kùzu’s and SightXR’s interactive exploration, large unstructured datasets become transparent and navigable. We hope that this approach can accelerate data-driven decisions, drive deeper insights, and better support organizations in deriving value from their unstructured data.
Discover Kùzu & Kineviz and contact us to learn more today.