
The NoSQL vs. Relational Database: Working with GraphXR to understand the difference
When it comes to analyzing connected data at scale, analysts are often faced with one of two common database systems: SQL/ relational databases (RDBMS) and NoSQL/ graph databases. Though distinctly different from one another, understanding their differences and specific use cases can help us build analytical performance and exploratory prowess down the line.
To start simply, we work with our front-end application to draw the contrast. GraphXR itself is not a database but it does provide a flexible 3D visualization platform that enables users to analyze data drawn from a graph database or other data source. By connecting GraphXR to either a SQL (RDBMS) and NoSQL database (i.e. hierarchical documents, graph databases, and mixed databases), a user can manipulate and export data-driven analysis, for example, through a Neo4j-stored graph or a local repository (i.e. a CSV file). However, first things first….
What is a relational database and how does it work?
The RDBMS model developed in the early 1970’s and over the following decades let users organize data into tables that were indexed with keys. Similar to physical indexing systems people were already used to, the tables and key system allowed for fast data lookups using MySQL query language. A set of reliability guarantees is provided in the form of ACID compliance, which stands for:
For ensuring that sensitive data are always backed up, updated, and protected from false data or failed transactions, these reliability guarantees are critical. A good example of why you would need ACID compliance is an ATM. It has to manage sensitive accounts and constantly update the system with strict regulations. A bank wouldn’t want an account holder to draw $50 from their account on one machine and then, while the system was still being updated, go to a different machine to draw out the same $50.
But there are certain cases where ACID compliance is not a priority. Many NoSQL databases don’t provide ACID guarantees (although Neo4j and some others do), but instead offer a set of looser BASE guarantees for transactions.
A good visualization of the differences between the ACID and BASE is through Eric Brewer’s CAP Theorem (Stonebraker 1). It assesses transactions in terms of Consistency, Availability, and Partition Tolerance and states that — in the case of a partition — a database can either prioritize consistency or availability. An ACID compliant system favors consistency because it wants the database to be current and correct at all times, thus it will limit the availability of the data until it is consistent and up to date. However, a BASE system favors availability because it cares less about the consistency of the data, thus allowing the user to have access to data that may be out of date just so long as it can get it in the hands of the user.
Exploring relationships: Graph vs RDBMS
For exploring patterns and relationships in data, though, more relaxed guarantees can likely meet users’ needs when dealing with data intake, cleaning, or map-reduce.
Ironically, exploring relationships is difficult and potentially very slow on a RDBMS. Tabular data express relationships through keys and not as separate entities. To model new relationships, a complex query with a relational database may require many joins, a process which creates an entire new table from existing ones, making it computationally expensive.
The same computation in a graph is exponentially faster. Graph databases model data as nodes and edges, rather than tables linked by key values. A node is modeled as a category and an edge as a relationship. The data model or schema itself is not only flexible and extensible but you can also add new categories and relationships fairly easily.
Here is a simple example going back to the bank account analogy:
RDBMS
Let’s start off with 2 tables:
Customer Table: a key (customer_id), a customer_name, and an owned_property. Somehow, the schema allows just one owned_property per customer.
Accounts Table: a key (customer_name, which relates this table to the customer table), an account_number, and a balance.
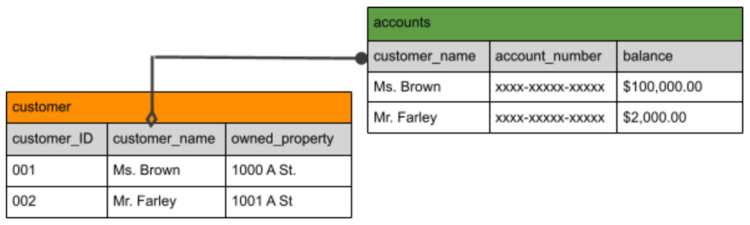
Suppose the account holder Ms. Brown buys another house that would lead to a new address. You can’t just add another Ms. Brown row with the same key, because then duplicate primary keys would be created leading to confusion.
Graph Database
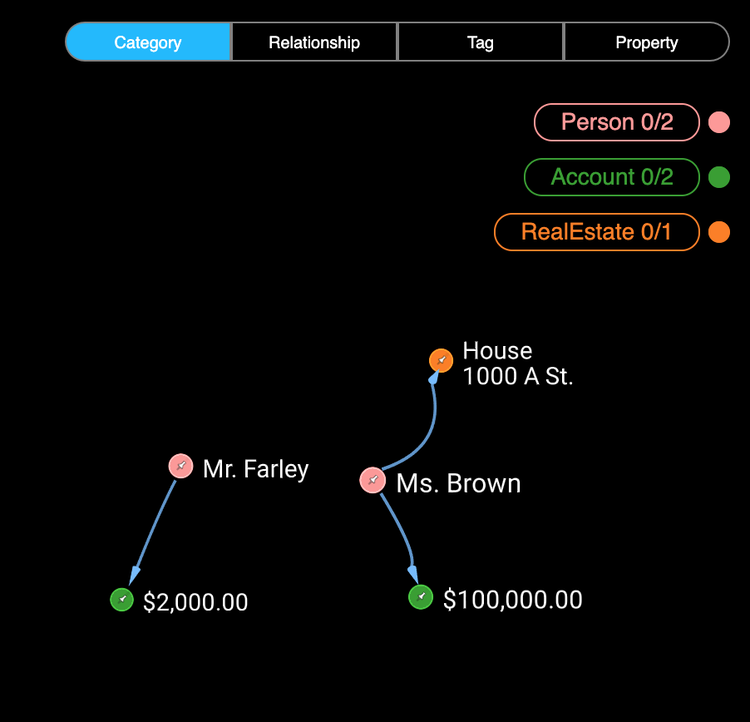
- In GraphXR, you can define Person, Account, and RealEstate as categories, and define a owns relationship between them.
- When Ms. Brown buys her second house, you just add a new Address node and connect it with a newly defined edge to Ms. Brown.
Since you can query categories and relationships directly, it’s much easier and faster to visualize and explore new or hidden connections in data. For example, in both Neo4j and GraphXR, you can collect, explore, and transform data directly in ways that are impossible in an RDBMS.
With graph data, computation is much faster for graph algorithms such as path-finding and community detection. Instead of looking through data structures via keys, graphs conduct lookups by traversing connected nodes. With relationships as explicit entities the graph structure can be traversed via index-free adjacency. But it must be noted that when querying data that contains no relationships, fetch speed can slow down.
Ultimately, the choice between the RDBMS and graph models is based on the data you are dealing with and what you need it to tell you. If your data would fit well in table format, and is not especially complex, an RDBMS might take care of all your needs. But if your data is constantly growing in both size and complexity, or if you are mainly interested in exploring connections and relationships, a graph environment might be the right option. Injecting RDBMS data into GraphXR can allow one to preserve benefits of an RDBMS while also gaining the power of data manipulation and visualization that the graph model provides.
References:
Stonebraker, Michael. “Errors in database systems, eventual consistency, and the cap theorem.” Communications of the ACM, BLOG@ ACM (2010).
- Originally published at https://www.kineviz.com on November 10, 2020.