


Human-centered Intelligence
We provide a visual platform to collect and expand on complex connections in data, uncovering hidden patterns and fostering informed decision-making.

Case Studies
From counter-terrorism to medicine, journalism to manufacturing.

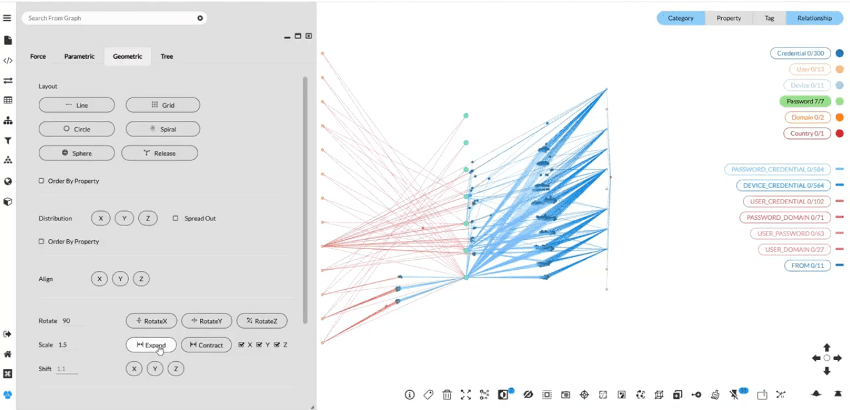
Using network visualization to deplatform an extremist group from social media
A multinational law enforcement agency found whack-a-mole ineffective against extremist recruiters on social media. To disrupt the recruitment operation, the LEA needed to deplatform the entire network of extremist-affiliated accounts simultaneously.

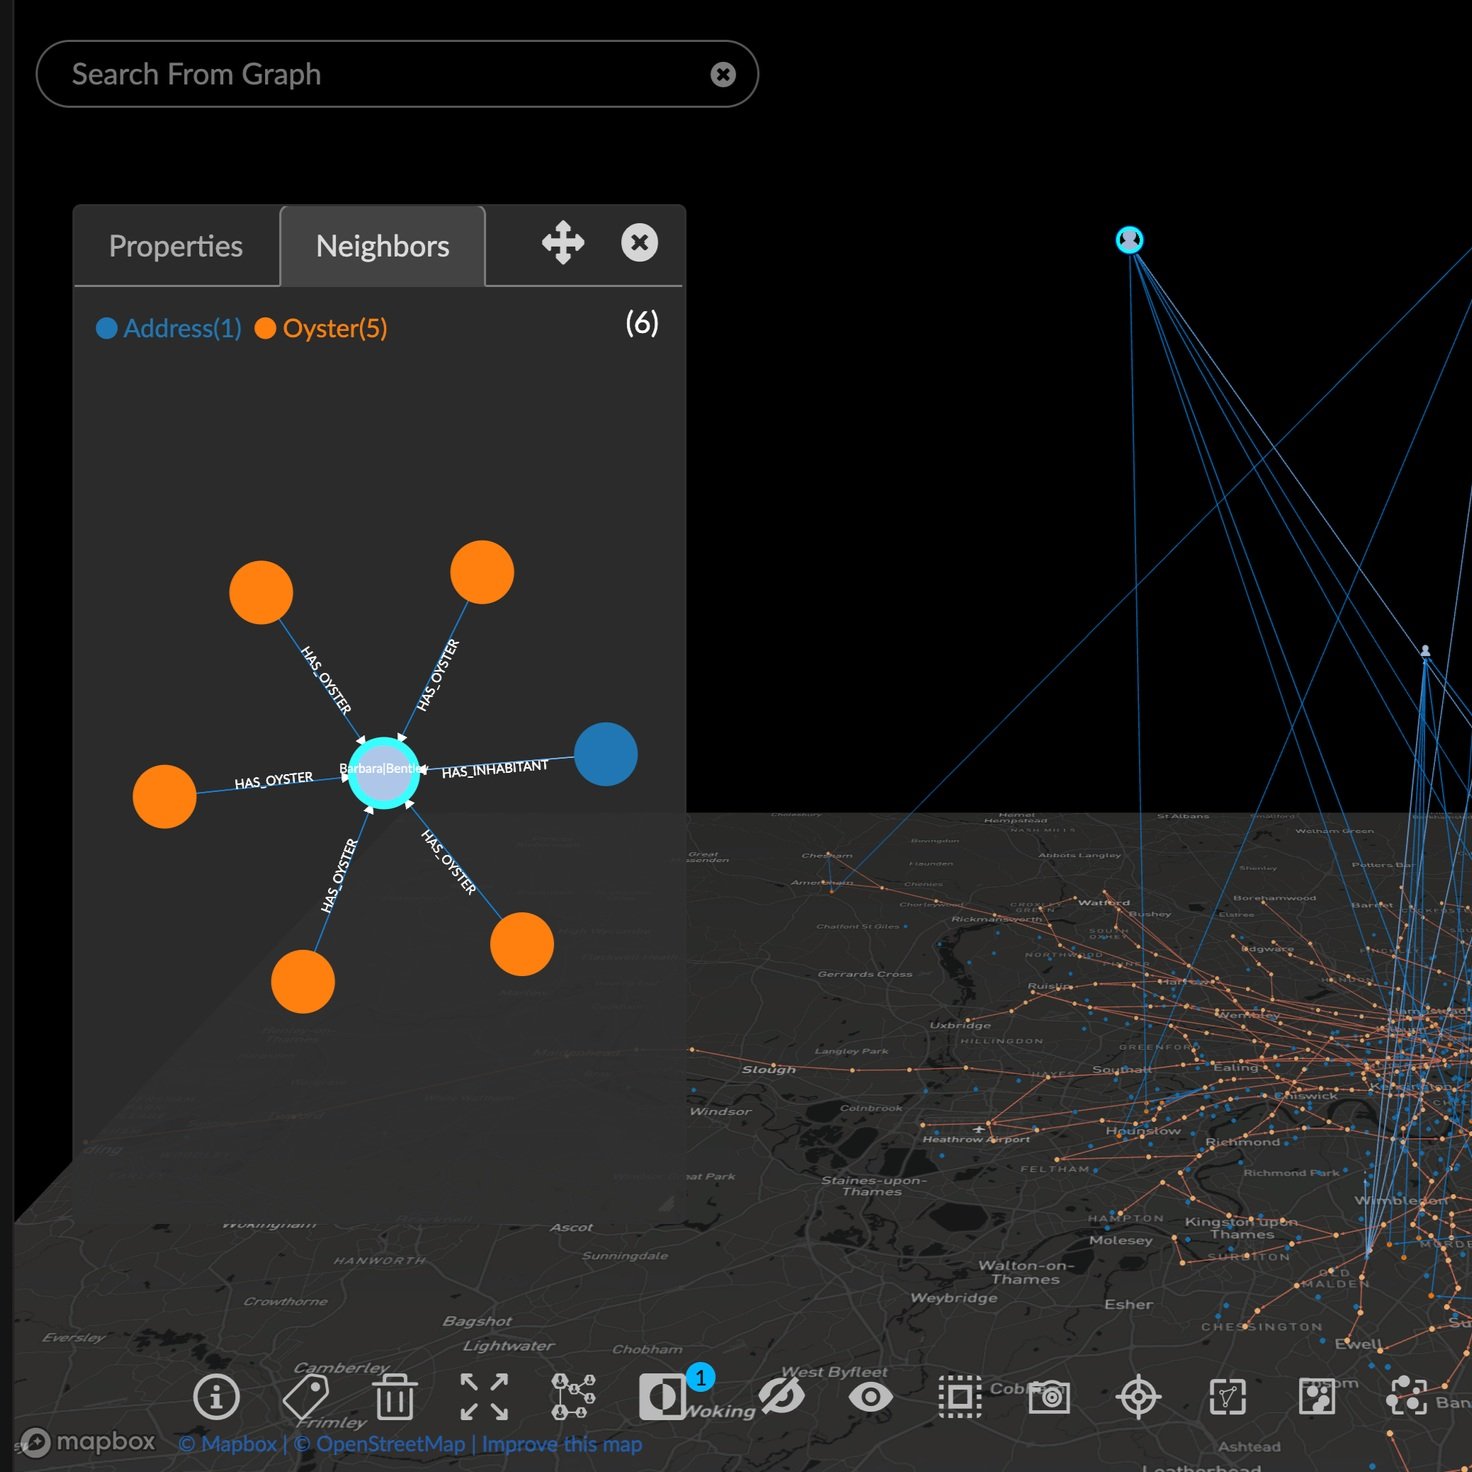
Visualizing Geospatial and Time Series Data for Law Enforcement
The Dutch police used GraphXR to transform OSINT data into dynamic geospatial maps and provide rapid visualization and graph analysis, revealing unexpected patterns in illegal drug production.

Real-time big data threat detection in online gaming
When an online gaming platform needed to analyze a massive 40 million events per day, standard BI tools were overwhelmed—missing subtle signs of collusion and fraud. By integrating a real-time detection system with advanced big data analytics, they were able to quickly identify evolving threats and take action before it was too late.

Fighting collusion in gaming using graph
A horse racing regulator sought to create a faster, more effective workflow that its small team of investigators could use to tackle fraud, expose criminal networks, and strengthen data integrity. The most pressing focus was to examine instances of potential collusion, while maintaining high confidence in the accuracy of their findings.

“You just enabled us to do in 3 minutes what used to take us 3 days.”
Manager, Betting & Intelligence Unit
See the connections that matter
Your data already holds the answers. GraphXR reveals the relationships between them so you can make better decisions, faster.
When is it safer to drive in New York City?
Using GraphXR and motor vehicle collision data, we mapped crash patterns across every hour and day of the week. Our WeekDial visualization transforms temporal and geographic data into actionable insights for urban traffic safety.