
Financial Fraud Detection at Scale: Visual Graph Analytics with Google Cloud Spanner Graph & Kineviz GraphXR
Chasing Online Fraud — A Constantly Changing Problem
Financial fraud is sophisticated: to detect it, you must recognize suspicious patterns of connection between users as an attack is quietly being prepared. Moreover, fraudsters constantly devise new strategies to avoid detection. In first-party fraud, where an individual purposely misrepresents their identity in exchange for goods or services, a fraudster will often recruit money mules — people who are persuaded to use their own information to obtain credit or merchandise on behalf of a larger fraud ring, often unknowingly. This type of fraud has become especially prevalent, with Experian reporting that money mules constitute up to 0.3% of accounts at U.S. financial institutions, or an estimated $3 billion in fraudulent transfers.
Visualization is an effective way to surface emerging fraud reliably. Preventing losses is much easier when an investigator can rapidly discover and verify emerging patterns of fraudulent behavior hidden in large volumes of data. But traditional, table-based tools cannot efficiently surface the complex, connected patterns. Even though patterns are implied in the underlying tables, querying for them is slow and awkward, especially when multiple table joins are required. Furthermore, query results are not returned as visual patterns, making it much harder to find or evaluate the connections you are looking for.
Graph visualization does represent patterns explicitly. You query for a pattern along connecting edges, and see the returned patterns immediately — ideal for detecting collusion quickly enough to prevent loss. Until now, pulling graph patterns from relational data has relied on extract, transform, and load (ETL) processes that reformat and replicate data in a separate graph database. Unfortunately, for large datasets this raises severe and continuing performance and synchronization headaches.
Graph Data via GCP Spanner Graph
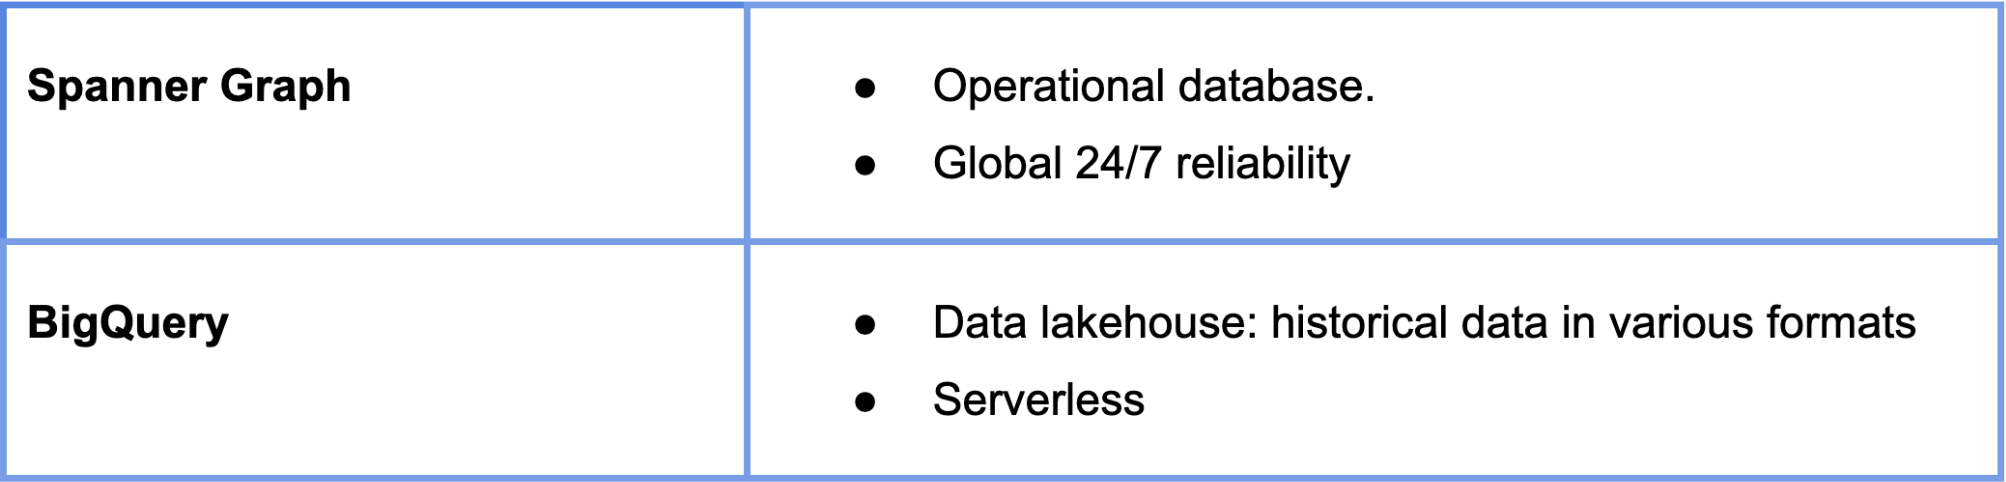
The new Google Cloud Platform (GCP) provides game-changing capability to explore graph patterns that exist in structured relational data. GCP now provides a semantic layer that lets you model a graph from existing transactional and analytical data sources — with no need to use ETL, and therefore no need to move or replicate the source data.
Data can now be used when and as it’s needed. Access is unified and streamlined, such that Spanner Graph operational data and BigQuery data lakehouses can work seamlessly as one. With these new features, GCP delivers unmatched scalability and performance to graph workloads, bringing graph capability to both real-time operational data and the data lakehouse.
Immersive Visual Analytics for Graphs
It’s not enough just to re-cast the data as a graph. That’s why Google’s vision for a unified graph solution emphasizes the need for visualization.
GCP partnership with Kineviz delivers key GraphXR visual analytics that can bring Spanner Graph data to life. GraphXR supports two important workloads in enterprise analytics:
The first is EDA (exploratory data analytics), where you discover new patterns through visual analytics, and verify patterns of interest. GraphXR provides low-code visual analytics in a platform that integrates directly with Spanner Graph.
The second is ongoing monitoring of known patterns and signals. This is best done with a “standing query”, that is, a backend persistent query or regularly scheduled query implemented in a project-based dashboard. Monitoring detects events of interest, often with a specified level of certainty. Human judgement is employed for verification when needed, and GraphXR visual analytics provide the immediate ability to evaluate the results.
Detecting Fraud by Money Mule
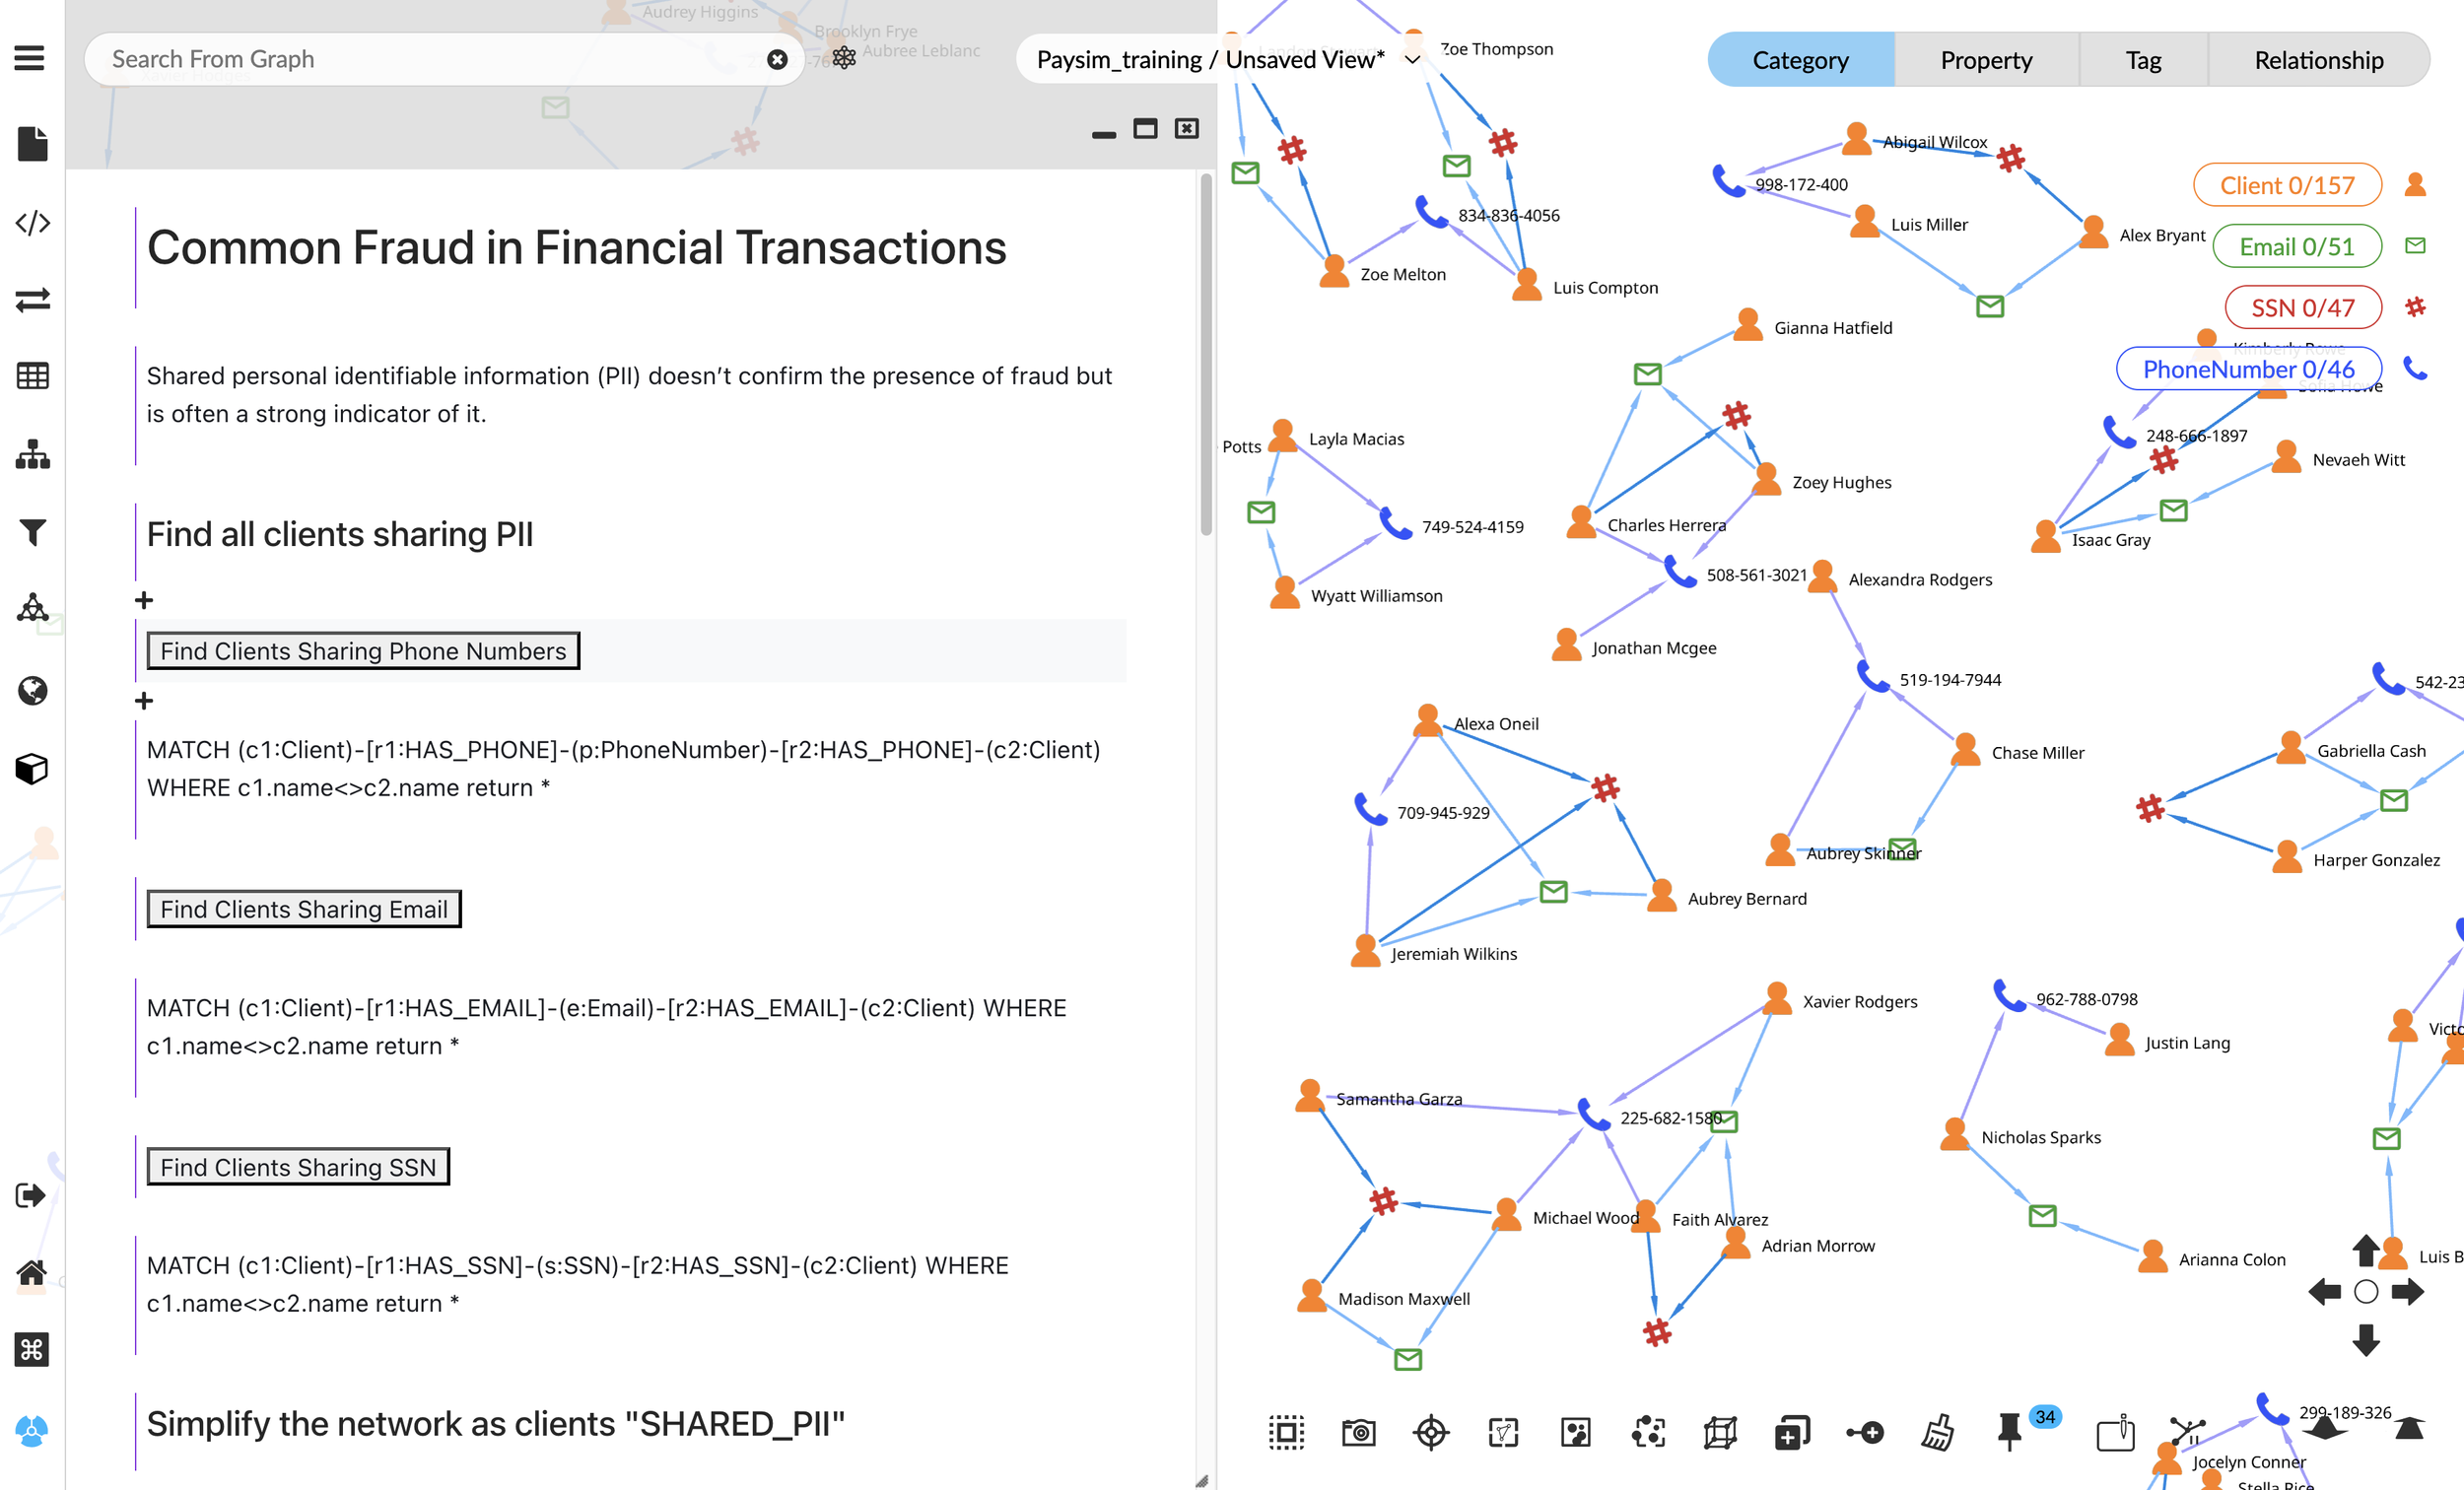
We use simulated data to show how GraphXR visual analytics enables rapid forensic investigation of potential money mules. We start by querying for customers with shared personal identity information (PII). This is a signature of many fraud schemes: money mules, fake ID rings, organized refund abuse, and others. With GraphXR visual analytics, we transform the initial graph to highlight patterns indicating collusion among clients and focus on suspicious behavior over time. Queries and transformations implemented in GraphXR’s built-in project notebook become a project dashboard supporting ongoing, repeated investigation.
Visual Analytics Workflow in GraphXR
A GraphXR project and its Grove dashboard is the hub for connecting to the PaySim data source and organizing the workflow of the investigation.

GraphXR already provides low-code or no-code transformation of graphs along with powerful visualization and team collaboration. With Grove, GraphXR’s notebook and dashboard, we can build repeatable, one-click widgets that specify data sources, organize queries to deliver graph data to a project, and transform the graph for visual clarity and analysis. One or more dashboards can be created in the project, available for use as needed, and for sharing among project teams.
Finding Fraud via Mule Accounts in GraphXR
The following demo shows how, in just a few clicks, an investigator can access a connected Spanner Graph database to zero in on patterns that clearly signal fraud via mule accounts.
The investigation workflow is:
1. One-click data load and transformation
The GraphXR Grove dashboard provides connection and one-click widgets to query for graph data from our simulated PaySim data stored in Spanner Graph, and to transform the graph for visual clarity.
2. Find customers sharing personal identity information (PII)
An investigator can simply click buttons in the dashboard to query for patterns where two or more customers share the same phone number, email, and Social Security Number (SSN).
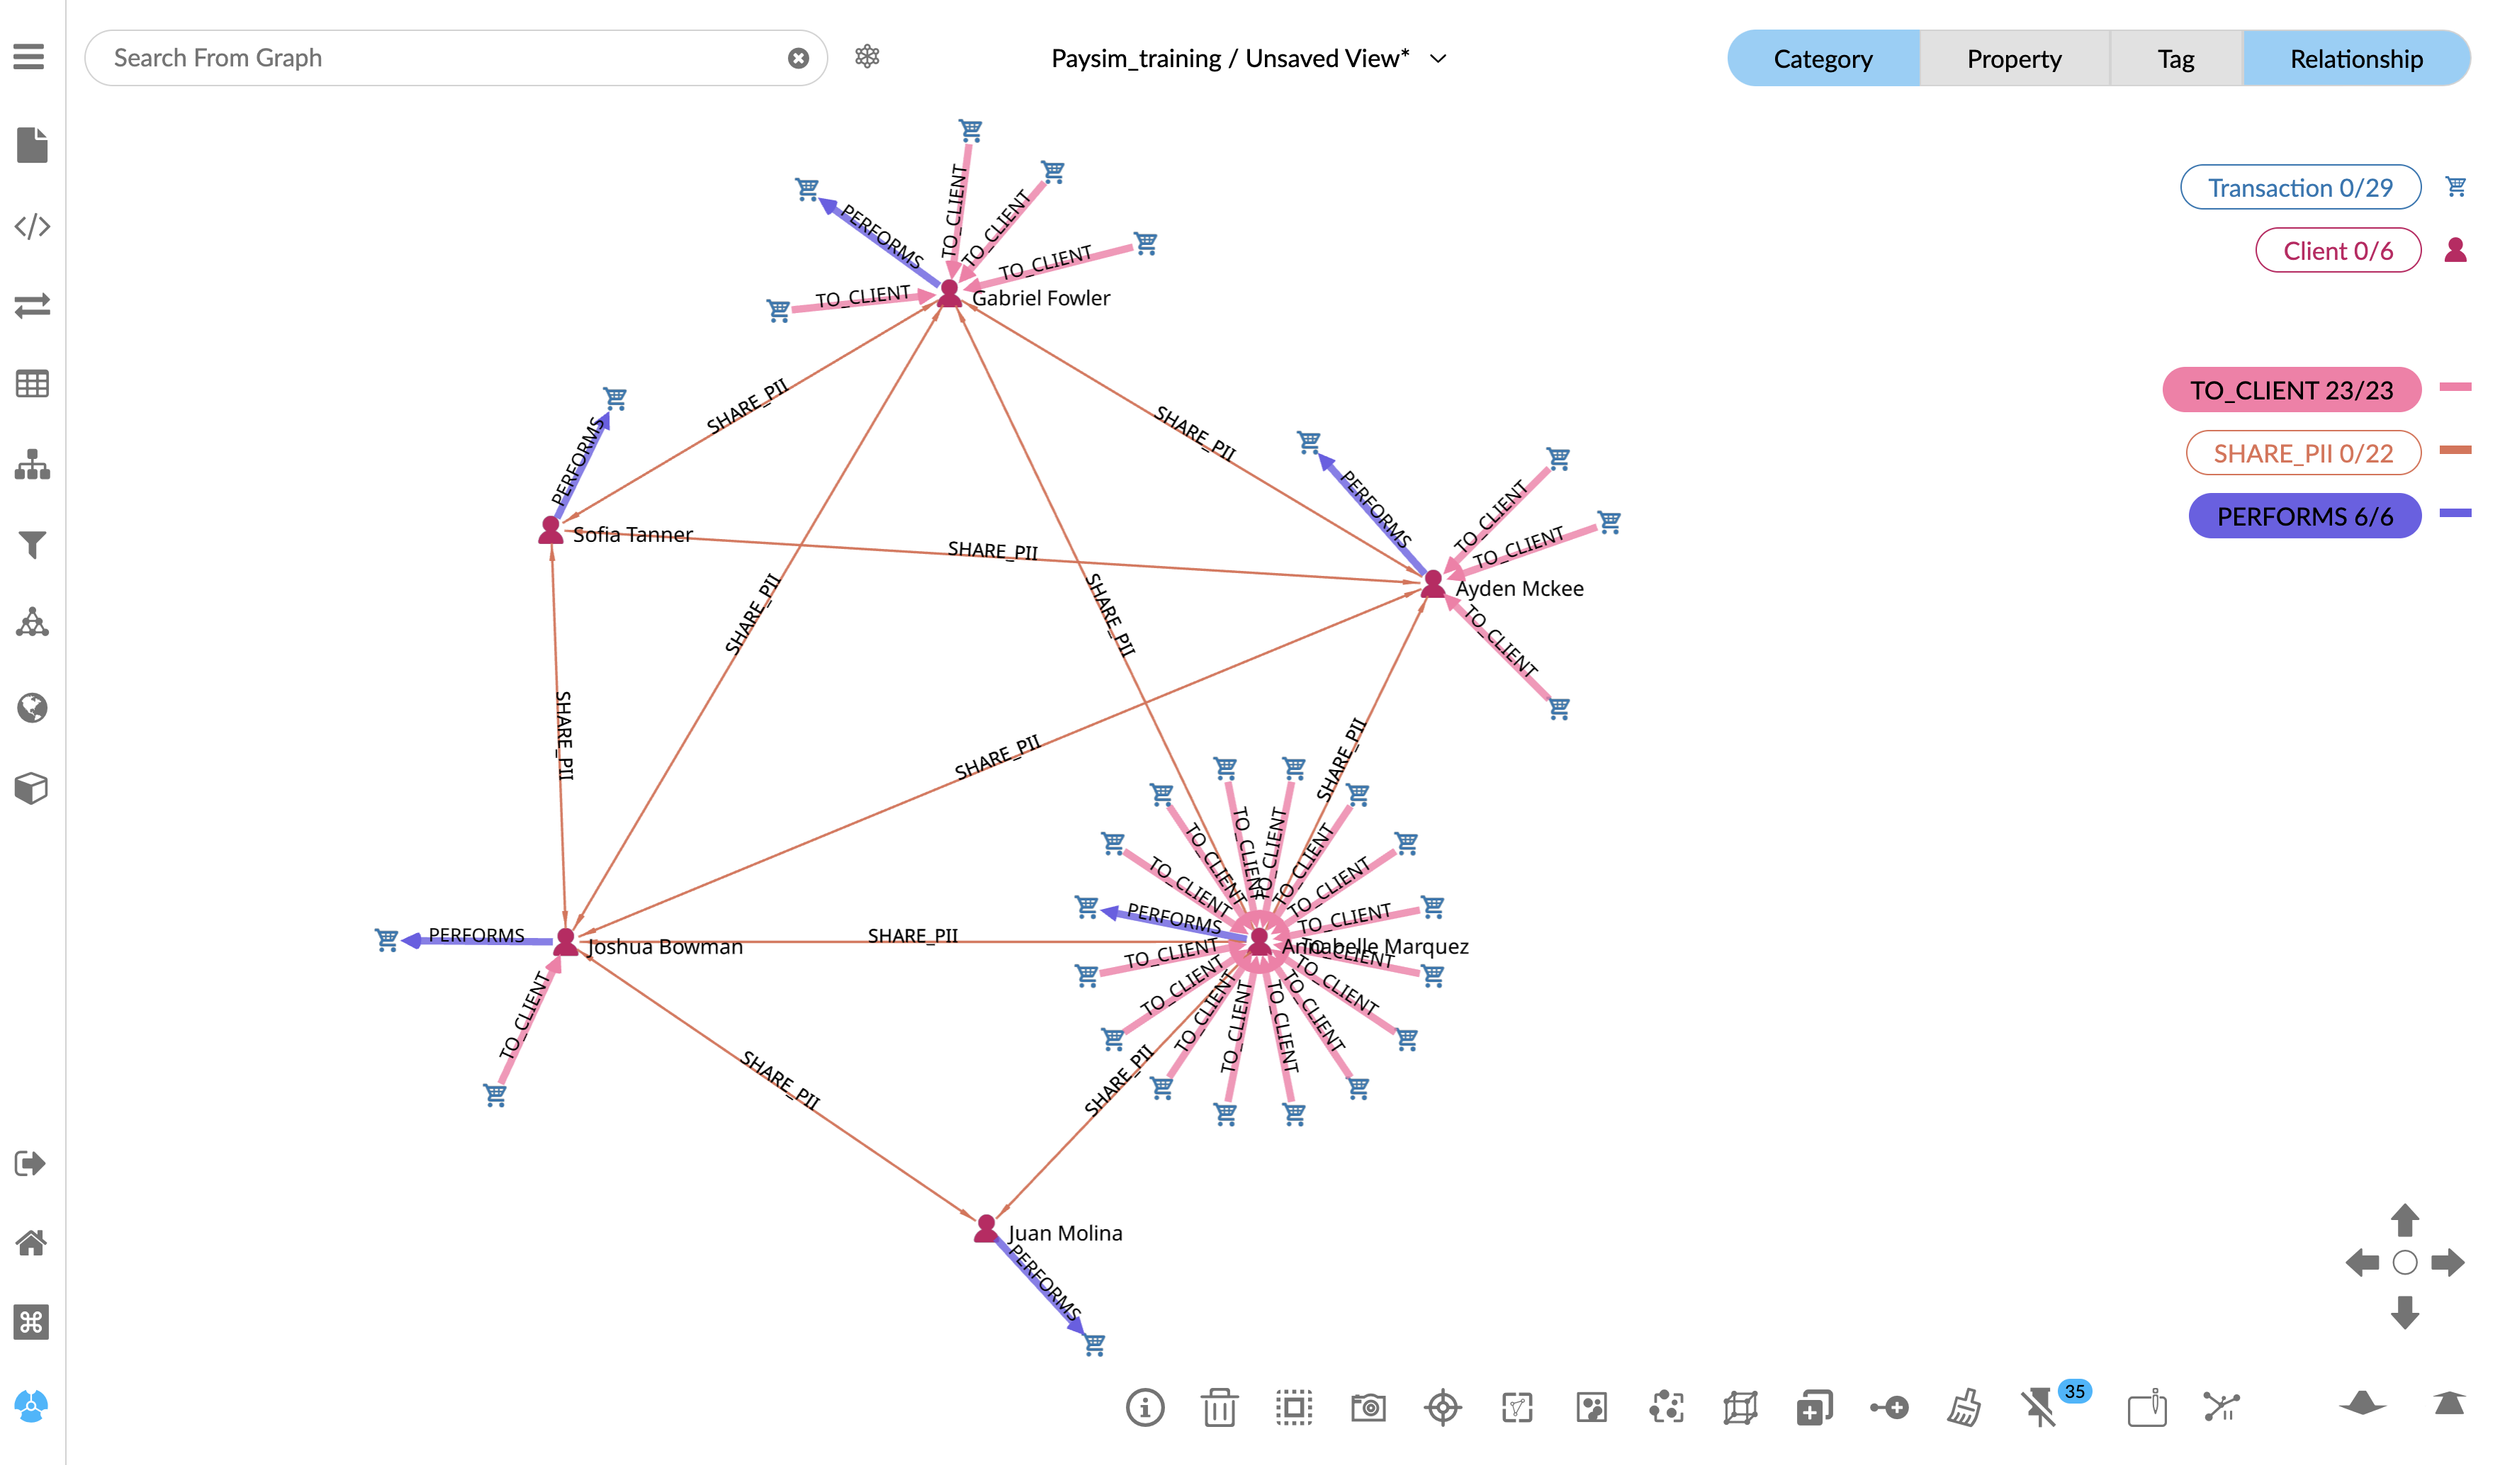
3. Transform the graph to highlight rings of colluding clients
Through the one-click Simplify button implemented in the dashboard, we infer and create a direct SHARE_PII relationship between the clients. This transforms the graph to provide a clear view of relations among customers. Instantly, distinct rings of interconnected clients jump out, revealing who is sharing credentials and how many clients are involved in the ring.

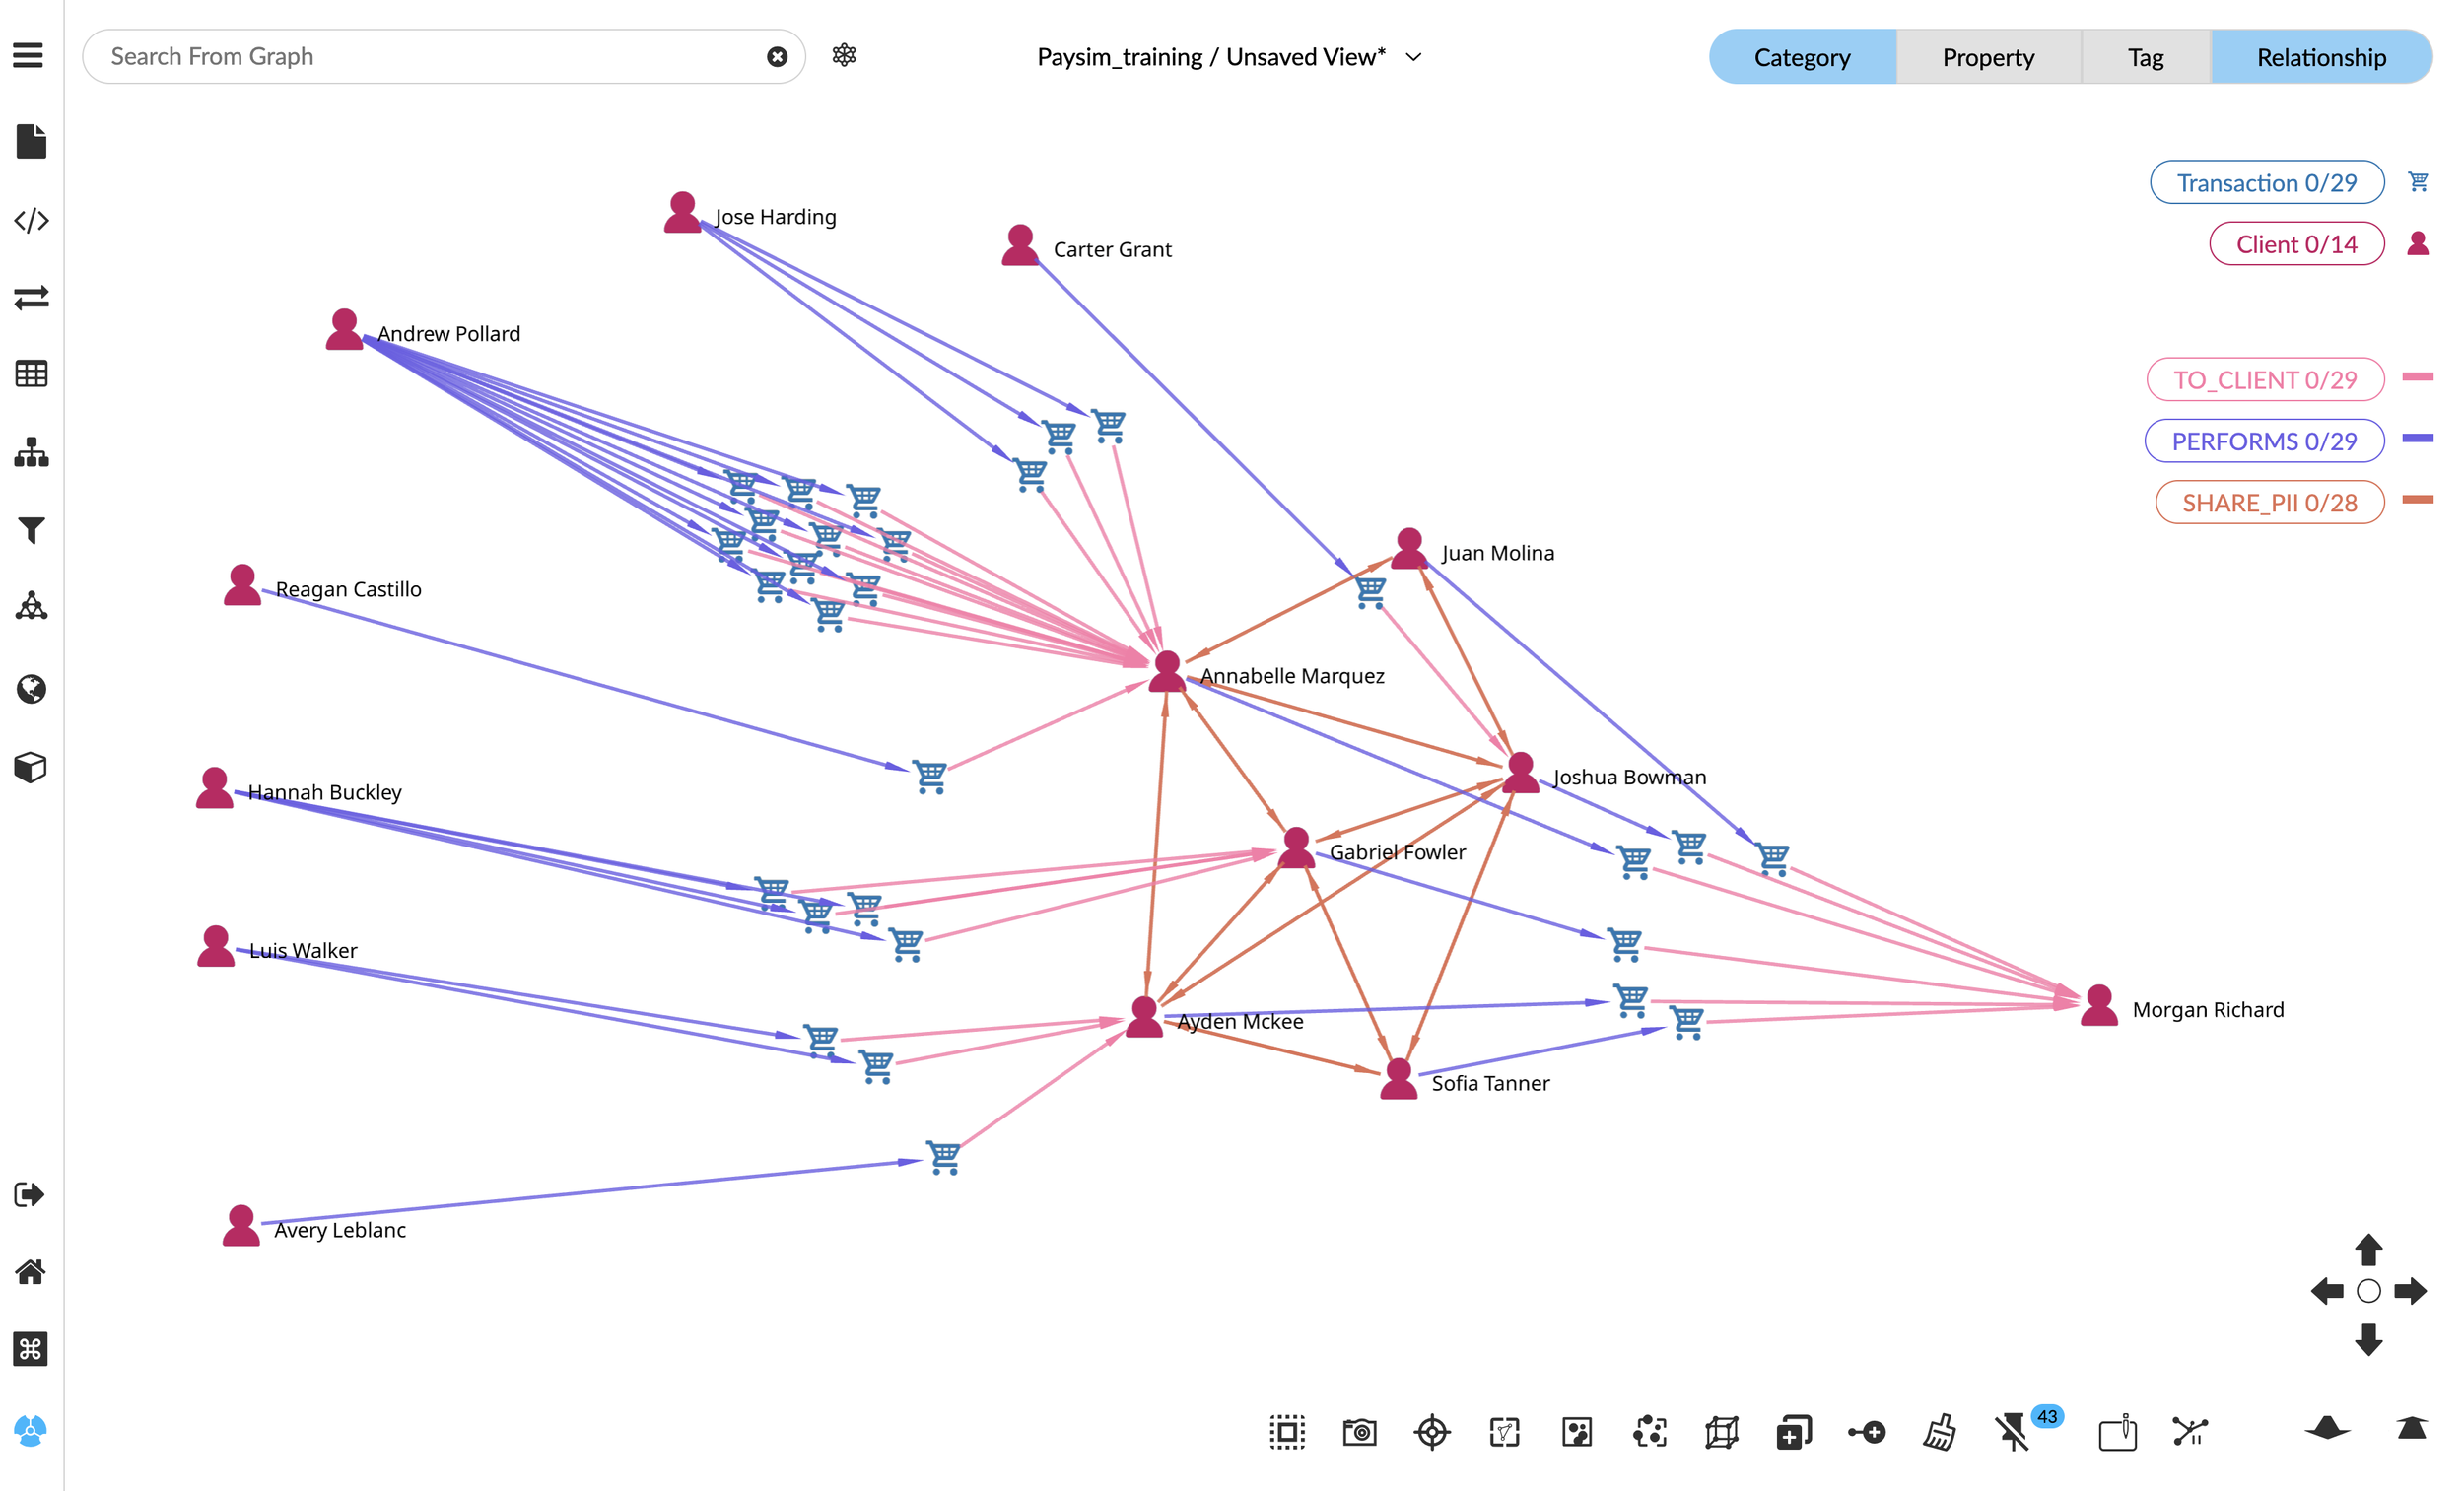
4. Zero in on a suspect cluster and investigate transactions
We focus on a cluster by selecting it and hiding the other data. Then, to look at flows of money, we use GraphXR’s one-click Expand feature to query for the transactions performed by or sent to these clients. The Expand function queries along the selected relationships to pull in every transaction tied to our initial ring of suspected fraudsters — without writing another query.

5. Explore the expanded network of clients and transactions
Then we select the transactions and expand again to pull in the additional clients performing or sending money to the group.
6. Discover hidden suspects. With GraphXR selection and layout we arrange the graph to show money flow from left to right. We immediately see a different client who has received small amounts of money from each client in our initial group — indicating someone who is very likely to be the ultimate receiver of the stolen money. We also see that four of our initial suspects have received money from several additional clients — in transactions of varying amounts. Next we want to investigate the flow of money via those transactions.
7. Examine transaction timelines
Transactions that we select appear in a dashboard timeline chart. For example, when we select the transactions between Andrew Pollard and Annabelle Marquez, we immediately see a pattern of an initial small transaction followed by much larger ones — a signature pattern for many types of financial fraud.

We’ve now discovered what’s highly likely to be a fraud ring at an emerging stage. Now we can take action to freeze specific client accounts, and can point to solid evidence that the action is justified.
From data to defense: a solution that stops fraud in its tracks
Kineviz GraphXR is a unified vantage point across your data in GCP Spanner Graph. In our simulated fraud investigation, we quickly zeroed in on high-risk mule accounts where multiple money flows converge to a single receiver, and highlighted a specific fraudulent pattern where transactions start small and gradually increase over time.
GraphXR provides an environment for fast, iterative exploratory data analysis. It enables an analyst without coding expertise to formulate questions quickly, test and learn, and move on to new questions.
These capabilities go far beyond static dashboards — it’s dynamic, iterative, and investigative. It delivers what matters for effective fraud investigation and prevention, namely:
Speed: Minutes from raw data to an actionable graph.
Clarity: Ability to transform the graph to highlight visual patterns of collusion that table views hide.
Scalability: Scales along with GCP capability.
Repeatability: Dashboards to turn ad-hoc sleuthing into repeatable, proven investigator workflows.
GraphXR complements the existing suite of GCP products, particularly in the areas of Data Analytics and Machine Learning & AI by enabling data analysts to perform ongoing investigation, analysis, and tracking without the need to write queries or code.
Learn more
With Google Cloud and Kineviz, financial institutions now have a scalable, real-time solution for fraud detection that’s accessible to analysts, actionable for decision-makers, and adaptable to evolving threats.
Get Started with GraphXR & Google Cloud
https://www.kineviz.com/googlecloud
https://cloud.google.com/products/spanner/graph
Ready to see what your data is hiding?
Contact us for a custom demo and learn how you can stop fraud before it spreads.